


Ready to turn raw data into headline-grabbing insights? This turbo-charged Python data science tutorial shows you how to learn data science from scratch, giving you the keys to crunch numbers, spot trends, and build machine-learning models—fast. No CS degree, no problem; we start at zero and sprint to pro-level tricks loved by analysts at Netflix and Spotify.
You will set up a slick coding stack in minutes, master Pandas shortcuts, and launch portfolio projects that wow recruiters. Grab your coffee, fire up Jupyter, and let’s convert curiosity into career-changing skills before the next coffee break—your future in tech starts now.
Key Takeaways
Before we begin this exciting journey, here are the essential points you'll master:
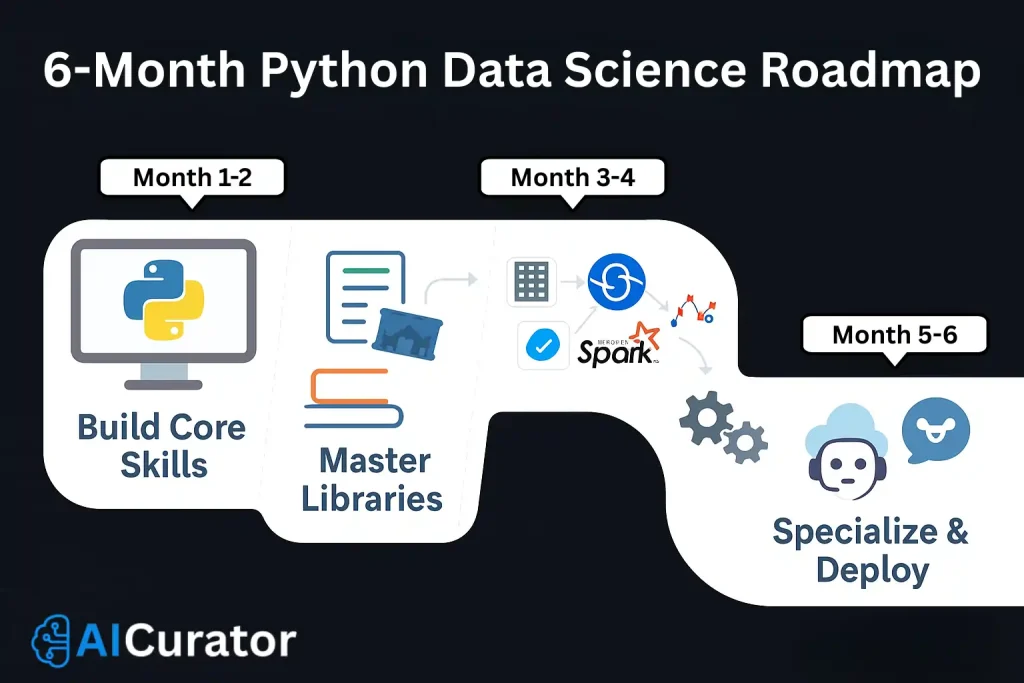
Your Complete Roadmap to Data Mastery with Python
Chapter 1: Setting Up Your Python Data Science Environment
Why Python Dominates Data Science in 2026
Python's popularity in data science isn't accidental. The language offers unmatched versatility with its extensive library ecosystem, making complex data analysis tasks surprisingly straightforward.
Major tech companies like Google, Netflix, and Spotify rely heavily on Python for their data-driven decision making.
Key advantages of Python for data science
Essential Software Installation Guide
Step 1: Install Python 3.11 or Later
Download the latest Python version from the official website. Python 3.11 offers 25% faster performance compared to previous versions, making it ideal for data-intensive tasks.
Step 2: Set Up Anaconda Distribution
Anaconda provides a complete data science environment with pre-installed packages:
bash
# Download Anaconda Individual Edition
# Install Jupyter Notebook, Spyder, and VS Code integration
conda create --name datascience python=3.11
conda activate datascience
Step 3: Install Essential Packages
python
pip install numpy pandas matplotlib seaborn scikit-learn
pip install tensorflow pytorch jupyter plotly
Chapter 2: Python Fundamentals for Data Scientists
Variables and Data Types Mastery
Understanding Python's data types is crucial for efficient data manipulation:
python
# Numeric data types
integer_var = 42
float_var = 3.14159
complex_var = 3 + 4j

# String operations for text data
text_data = "Data Science with Python"
processed_text = text_data.lower().replace(" ", "_")

# Boolean logic for filtering
is_data_scientist = True
has_python_skills = True
Control Structures for Data Processing
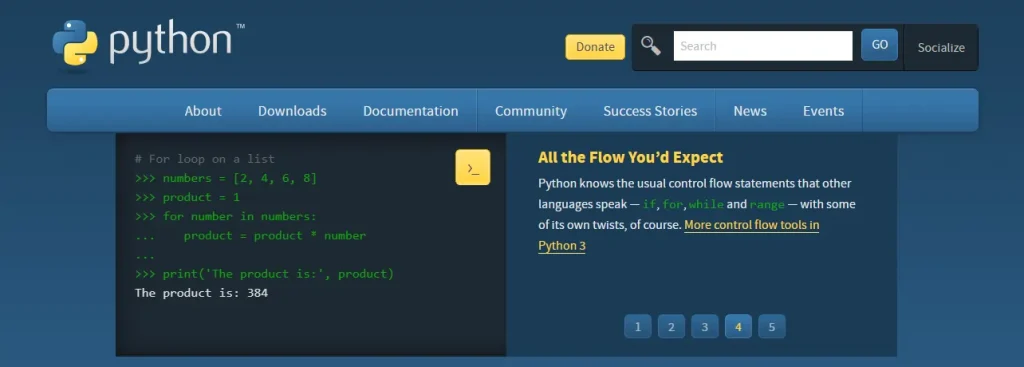
Conditional statements and loops form the backbone of data processing workflows:
python
# Data quality checking with conditionals
def check_data_quality(dataset):
    if dataset.isnull().sum() > 0:
        print("Warning: Missing values detected")
        return False
    elif dataset.duplicated().sum() > 0:
        print("Warning: Duplicate records found")
        return False
    else:
        print("Data quality check passed")
        return True

# Iterative data processing
for column in dataset.columns:
    if dataset[column].dtype == 'object':
        dataset[column] = dataset[column].str.strip()
Chapter 3: Essential Python Libraries for Data Science 2026
NumPy: The Foundation of Numerical Computing
NumPy remains the cornerstone of Python data science with 2.4 billion downloads and 25k GitHub stars.
It provides optimised array operations that are 50x faster than pure Python lists.
python
import numpy as np

# Creating efficient arrays
data_array = np.array([1, 2, 3, 4, 5])
multi_dimensional = np.random.rand(1000, 1000)

# Mathematical operations
result = np.sqrt(data_array)
statistical_summary = np.mean(multi_dimensional, axis=0)
Key NumPy applications in 2026
Pandas: Data Manipulation Powerhouse
Pandas has revolutionised data analysis with its intuitive DataFrame structure, supporting 17,000+ comments on GitHub and an active community of 1,200 contributors.
python
import pandas as pd

# Loading data from multiple sources
df_csv = pd.read_csv('dataset.csv')
df_excel = pd.read_excel('data.xlsx', sheet_name='Sheet1')
df_json = pd.read_json('api_data.json')

# Advanced data manipulation
cleaned_data = (df_csv
                .dropna()
                .drop_duplicates()
                .reset_index(drop=True))

# Groupby operations for insights
summary_stats = df_csv.groupby('category').agg({
    'sales': ['mean', 'sum', 'count'],
    'profit': ['min', 'max']
})
Matplotlib and Seaborn: Data Visualisation Masters
Visual storytelling becomes effortless with Python's plotting libraries:
python
import matplotlib.pyplot as plt
import seaborn as sns

# Professional-quality plots
plt.figure(figsize=(12, 8))
sns.heatmap(correlation_matrix, annot=True, cmap='coolwarm')
plt.title('Feature Correlation Analysis')
plt.tight_layout()
plt.show()

# Interactive visualisations with Plotly
import plotly.express as px
fig = px.scatter_3d(data, x='feature1', y='feature2', z='target')
fig.show()
Chapter 4: Data Loading and Preprocessing Techniques
Multi-Source Data Integration
Modern data science projects often require combining data from multiple sources:
Database connections
python
import sqlalchemy as sa
from sqlalchemy import create_engine

# Connecting to SQL databases
engine = create_engine('postgresql://user:password@localhost/database')
sql_data = pd.read_sql('SELECT * FROM customer_data', engine)

# MongoDB integration
from pymongo import MongoClient
client = MongoClient('mongodb://localhost:27017/')
mongo_data = pd.DataFrame(list(client.database.collection.find()))
Web scraping for real-time data
python
import requests
from bs4 import BeautifulSoup

def scrape_financial_data(url):
    response = requests.get(url)
    soup = BeautifulSoup(response.content, 'html.parser')
    # Extract relevant financial metrics
    return processed_data
Advanced Data Cleaning Strategies
Professional data cleaning techniques that save hours of manual work:
python
# Handling missing values intelligently
def smart_imputation(df, column):
    if df[column].dtype in ['int64', 'float64']:
        # Use median for skewed numerical data
        return df[column].fillna(df[column].median())
    else:
        # Use mode for categorical data
        return df[column].fillna(df[column].mode()[0])

# Outlier detection and treatment
from scipy import stats
def remove_outliers(df, columns, z_threshold=3):
    for column in columns:
        z_scores = np.abs(stats.zscore(df[column]))
        df = df[z_scores < z_threshold]
    return df
Chapter 5: Exploratory Data Analysis (EDA) Mastery
Statistical Analysis Techniques
Descriptive statistics provide the foundation for understanding your data:
python
# Comprehensive statistical summary
def comprehensive_eda(df):
    print("Dataset Shape:", df.shape)
    print("\nData Types:")
    print(df.dtypes)

    print("\nStatistical Summary:")
    print(df.describe(include='all'))

    print("\nMissing Values:")
    print(df.isnull().sum())

    # Correlation analysis
    numeric_cols = df.select_dtypes(include=[np.number]).columns
    correlation_matrix = df[numeric_cols].corr()

    return correlation_matrix
Advanced Visualisation Patterns
Create publication-ready visualisations that tell compelling data stories:
python
# Distribution analysis
def plot_distributions(df, columns):
    fig, axes = plt.subplots(len(columns), 2, figsize=(15, 5*len(columns)))
    for i, column in enumerate(columns):
        # Histogram
        axes[i, 0].hist(df[column], bins=30, alpha=0.7)
        axes[i, 0].set_title(f'{column} Distribution')

        # Box plot
        axes[i, 1].boxplot(df[column])
        axes[i, 1].set_title(f'{column} Box Plot')

    plt.tight_layout()
    plt.show()

# Time series analysis
def time_series_analysis(df, date_column, value_column):
    df[date_column] = pd.to_datetime(df[date_column])
    df = df.sort_values(date_column)

    # Trend analysis
    rolling_mean = df[value_column].rolling(window=30).mean()

    plt.figure(figsize=(12, 6))
    plt.plot(df[date_column], df[value_column], label='Actual')
    plt.plot(df[date_column], rolling_mean, label='30-Day Moving Average')
    plt.legend()
    plt.title('Time Series Trend Analysis')
    plt.show()
Chapter 6: Machine Learning Implementation
Supervised Learning Algorithms
Classification and regression models form the core of predictive analytics:
python
from sklearn.model_selection import train_test_split
from sklearn.ensemble import RandomForestClassifier
from sklearn.metrics import classification_report, accuracy_score

# Model training pipeline
def train_classification_model(X, y):
    # Split the data
    X_train, X_test, y_train, y_test = train_test_split(
        X, y, test_size=0.2, random_state=42, stratify=y
    )

    # Train Random Forest model
    model = RandomForestClassifier(
        n_estimators=100,
        max_depth=10,
        random_state=42
    )

    model.fit(X_train, y_train)

    # Make predictions
    y_pred = model.predict(X_test)

    # Evaluate performance
    accuracy = accuracy_score(y_test, y_pred)
    report = classification_report(y_test, y_pred)

    return model, accuracy, report
Unsupervised Learning Techniques
Clustering and dimensionality reduction for pattern discovery:
python
from sklearn.cluster import KMeans
from sklearn.decomposition import PCA
from sklearn.preprocessing import StandardScaler

# Customer segmentation example
def customer_segmentation(customer_data):
    # Standardise the features
    scaler = StandardScaler()
    scaled_data = scaler.fit_transform(customer_data)

    # Apply PCA for dimensionality reduction
    pca = PCA(n_components=2)
    pca_data = pca.fit_transform(scaled_data)

    # K-means clustering
    kmeans = KMeans(n_clusters=4, random_state=42)
    clusters = kmeans.fit_predict(scaled_data)

    # Visualise clusters
    plt.figure(figsize=(10, 8))
    scatter = plt.scatter(pca_data[:, 0], pca_data[:, 1], c=clusters, cmap='viridis')
    plt.colorbar(scatter)
    plt.title('Customer Segmentation Clusters')
    plt.show()

    return clusters, kmeans
Chapter 7: Beginner-Friendly Python Data Science Projects
Kick-start your portfolio with six quick wins. Each project can be wrapped up in a weekend and showcases core skills every junior data scientist should master.
- Retail Sales Snapshot – uncover seasonal buying patterns with pandas and matplotlib.
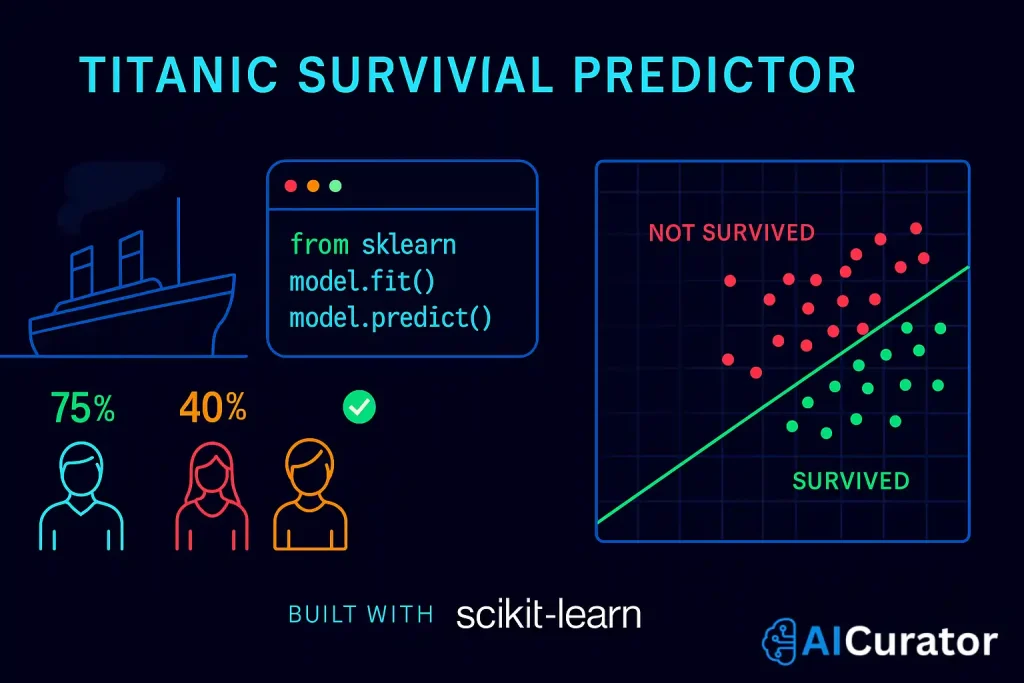
- Titanic Survival Predictor – build a simple classifier in scikit-learn to forecast passenger survival.
- Mini Movie Recommender – craft a basic collaborative filter using numpy matrix tricks.
- Tweet Sentiment Monitor – label tweet mood with NLTK and logistic regression.
- Stock Price Forecaster – fit an ARIMA line in statsmodels to predict next-day closes.
- Weather Trend Visualiser – map temperature swings worldwide with seaborn.
Pro Tip
Fetch the open dataset, run a brisk EDA, polish the notebook, push it to GitHub, then post a 300-word recap on LinkedIn or Medium to grab recruiter attention.
Chapter 8: Career Acceleration and Best Practices
Building a Professional Portfolio
Showcase your expertise with these portfolio essentials:
Portfolio Structure
Industry Best Practices
Professional coding standards that employers expect:
python
# Clean, documented code example
def calculate_customer_lifetime_value(
    customer_data: pd.DataFrame,
    revenue_column: str,
    time_period_months: int = 12
) -> pd.Series:
    """
    Calculate Customer Lifetime Value (CLV) for each customer.

    Parameters:
    -----------
    customer_data : pd.DataFrame
        Customer transaction data with revenue information
    revenue_column : str
        Name of the column containing revenue values
    time_period_months : int, default=12
        Time period for CLV calculation in months

    Returns:
    --------
    pd.Series
        Customer Lifetime Values indexed by customer ID

    Example:
    --------
    >>> clv_scores = calculate_customer_lifetime_value(
    ...     data, 'revenue', time_period_months=24
    ... )
    """

    # Input validation
    if revenue_column not in customer_data.columns:
        raise ValueError(f"Column '{revenue_column}' not found in data")

    # Calculate CLV using cohort analysis
    monthly_revenue = customer_data.groupby('customer_id')[revenue_column].sum()
    average_monthly = monthly_revenue / time_period_months

    # Apply retention rate multiplier
    retention_rate = calculate_retention_rate(customer_data)
    clv = average_monthly * retention_rate * time_period_months

    return clv
Continuous Learning Roadmap
Your Data Science Journey Starts Now
Congratulations! You now possess a comprehensive roadmap to master Python for data science. With over 200,000 Python packages available and a thriving community of millions of developers, you're joining one of the most dynamic and rewarding fields in technology.
Let's dive deeper into the essential libraries and projects.
The projects and techniques covered in this tutorial represent real-world applications used by leading companies worldwide. From Netflix's recommendation algorithms to Tesla's autonomous driving systems, Python powers the innovations shaping our future.
Your next steps
- Start with the environment setup and basic projects
- Build 3-5 portfolio projects in your first month
- Join the Python data science community on GitHub and Stack Overflow
- Apply for internships or entry-level positions to gain practical experience
- Continuously learn new libraries and stay updated with industry trends
Remember, consistency beats perfection. Spend 30 minutes daily practising Python, and within 6 months, you'll have the skills needed to excel in any data science role.
The data revolution is here, and Python is your ticket to success. Start coding today, and transform your career tomorrow!


